
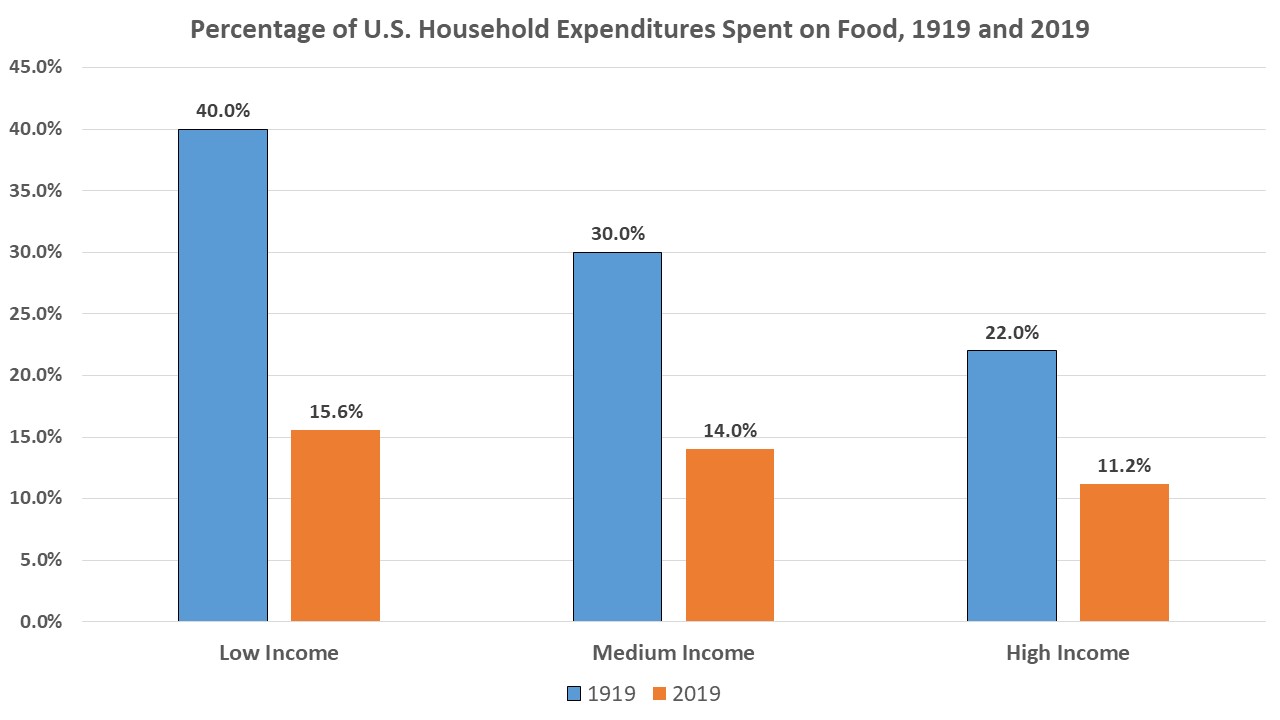
It seems like food is expensive today, but we actually spend a much lower percentage of our total household expenditures on food now than what our ancestors did a hundred years ago. For example, a typical medium income family in 1919 in the United States spent 30% of total expenditures on food, while today a medium income family spends only 14% on food.
Here is additional information about the data that I used to prepare this chart:
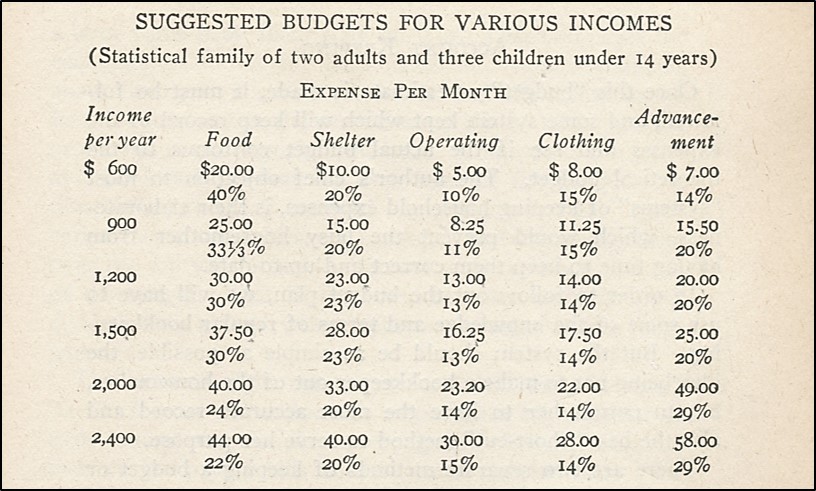
1919 – The 1919 data are from a table in a 1919 book by Mrs. Christine Frederick titled Household Engineering: Scientific Management in the Home. It was published by the American School of Home Economics (Chicago). See the table below for the 1919 data. The table had information for six income levels. I used the lowest and highest income levels in the table in the book as the “low income” and “high income” respectively when preparing the chart at the top of this post. In the original table, the 3rd and 4th income levels (the middle levels), each spent 30% of their household income on food, so I used 30% as the middle level for 1919. The author of the book says that the expenditure information was collected and compiled “through an extensive survey made through a periodical (p. 284).”
2019 – Data are not yet available for 2019 household expenditures. The most recent year available is 2017, so I assumed that expenditures were similar in 2019 to what they had been in 2017. The data are from the Statistica site. The 2019 household expenditure data were presented by quintiles. Here are the food expenditure data for each quintile:
- 1st quintile: 15.6%
- 2nd quintile: 14.4%
- 3rd quintile: 14.0%
- 4th quintile: 13.0%
- 5th quintile: 11.2%
For the comparison chart, low income was considered to equal the 1st quintile, medium income equaled the 3rd quintile, and high income equaled the 5th quintile.
