18-year-old Helena Muffly wrote exactly 100 years ago today:
Thursday, May 15, 1913: Doing nothing of any account.
Her middle-aged granddaughter’s comments 100 years later:
Since Grandma didn’t have much to say a hundred years ago today, I’m going to follow-up on some comments I got several days ago—
On May 10, I did a post about whether Grandma’s name was really Helena or Helen. The post got lots of comments—and several people mentioned that their grandmother’s or great-grandmother’s name also was Helena or Helen.
This got me thinking about popular baby names in 1913—and popular names a hundred years later in 2013.
According the Baby Center website, none of the ten most popular baby names in 1913 were in the top ten in 2013.
17-year-old Helena Muffly wrote exactly 100 years ago today:
Thursday, March 13, 1913: Nothing doing.
Her middle-aged granddaughter’s comments 100 years later:
Since Grandma didn’t write much a hundred years ago today, I’ll go off on another tangent–
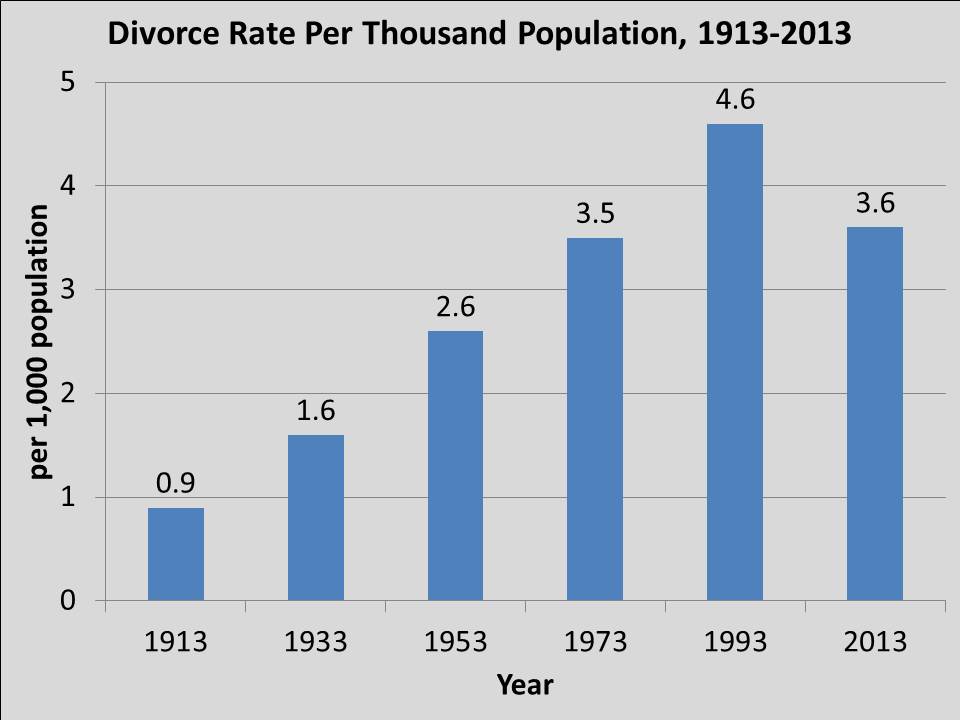
I’ve been reading some Edith Wharton books from the early 20th century—and one of the themes in her writing is unhappy marriages and the role of divorce. This made me wonder if divorce rates have changed much across the years.
The divorce rate was 0.9 per thousand population in 1913. It peaked at 4.6 in 1993; and decreased to 3.6 in 2013.
For those of you who care about the source of the data–The historic data is from Infoplease, and the data for the current year is from the Centers for Disease Control and Prevention. If data for the exact year were not available, I used data from the nearest available year (typically the first year of the decade–for example, I used 1910 data for 1913).
Here are links to some previous posts on statistics that you might enjoy:
17-year-old Helena Muffly wrote exactly 100 years ago today:
Friday, January 3, 1913:I’m so sleepy for I’m keeping later hours with my books Perhaps the thing will work all right after all. Hope it does.
Her middle-aged granddaughter’s comments 100 years later:
Grandma was still trying to keep her New Year’s resolution to study harder—though she complained both on January 2 and 3 about being sleepy.
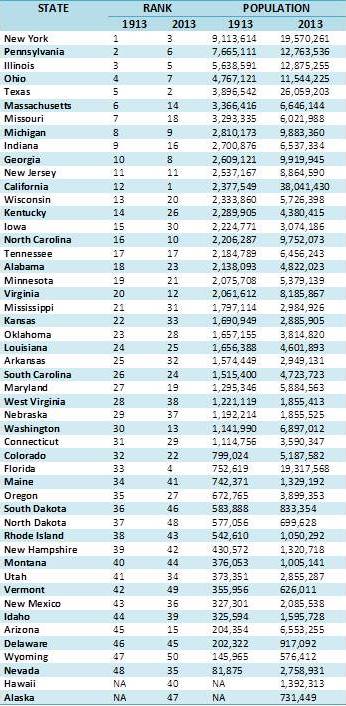
A hundred years ago students memorized more things than they do now. Might Grandma have been required to memorize geography facts such the names of the five states with the most people ? . . . and the five states with the fewest people.
Rank of States by Population, 1913 and 2013
I was surprised to discover how much the state ranks have changed over the last 100 years. In 1913, Pennsylvania—where Grandma lived— was the second most populous state in the US; now it is the sixth largest.
And, a hundred years ago, California was the 13th most populous state—today it is the state with the most people.
For those who are interested in the details about where I got the data for the table–I assumed that the population did not change between 1910 and 1913 and used data from the 1910 census for the 1913 estimates. I assumed that the population in 2013 is the same as it was in 2012. The 2013 estimates are based on April 1, 2012 estimates of the US population which were adjusted estimates based on the 2010 US Census.
17-year-old Helena Muffly wrote exactly 100 years ago today:
Saturday, November 30, 1912: Ruth and I washed this morning. Went to Watsontown this afternoon.
Click on graph to enlarge.
Her middle-aged granddaughter’s comments 100 years later:
Sounds like a nice way for Grandma to spend a Saturday—doing a little work in the morning with her sister Ruth, and then rewarding herself by going to town in the afternoon. Maybe Grandma started her Christmas shopping.
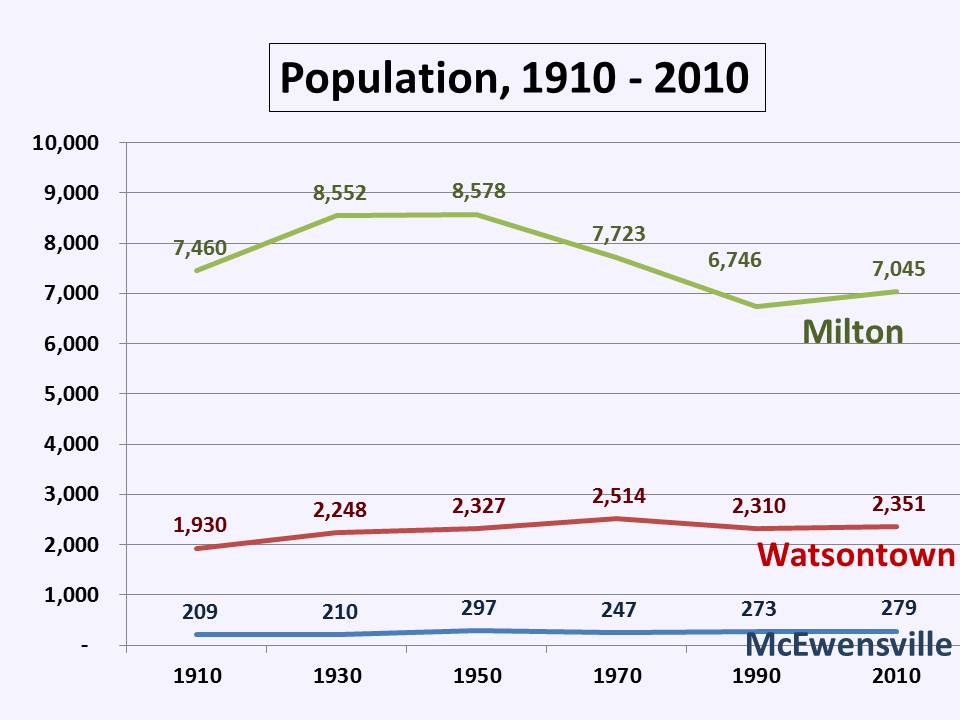
There are three towns regularly mentioned in this diary—all small in the big scheme of things, but within Grandma’s world there was a small town (McEwensville), a medium-sized town (Watsontown), and a large town (Milton).
Today none of the three would be much of a shopping destination—but a hundred years ago transportation was so much more difficult and each had stores.
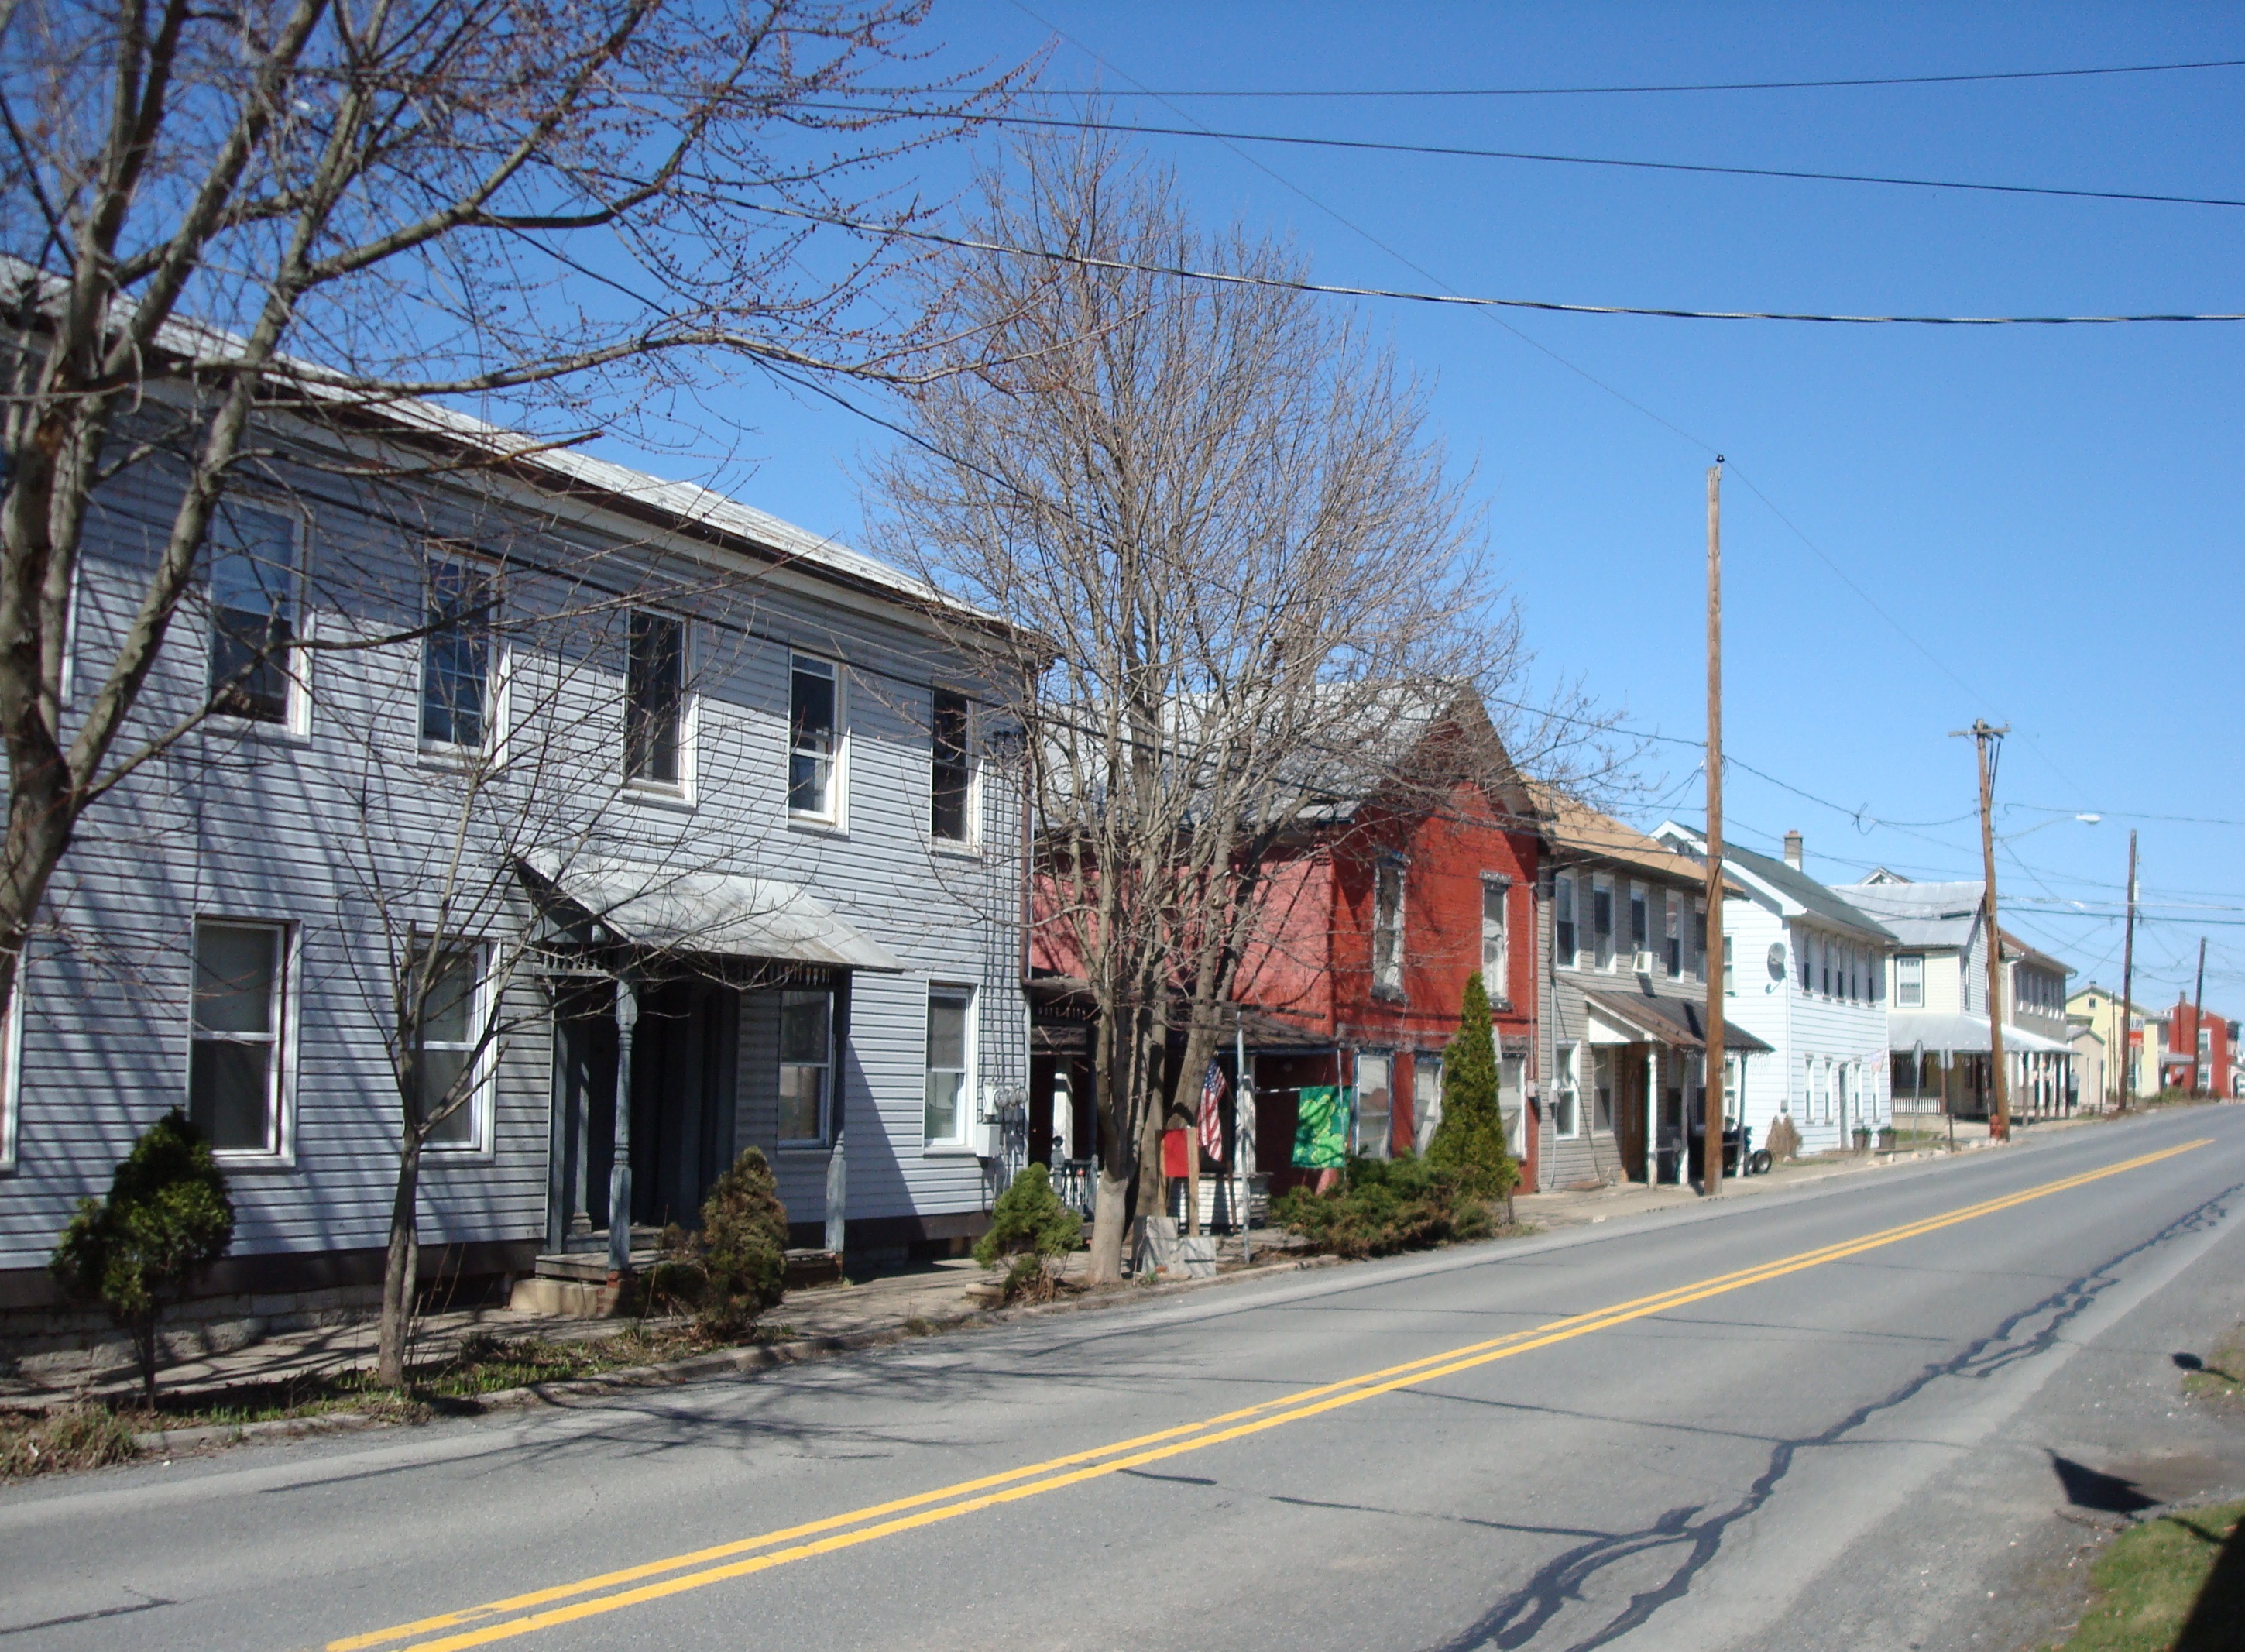
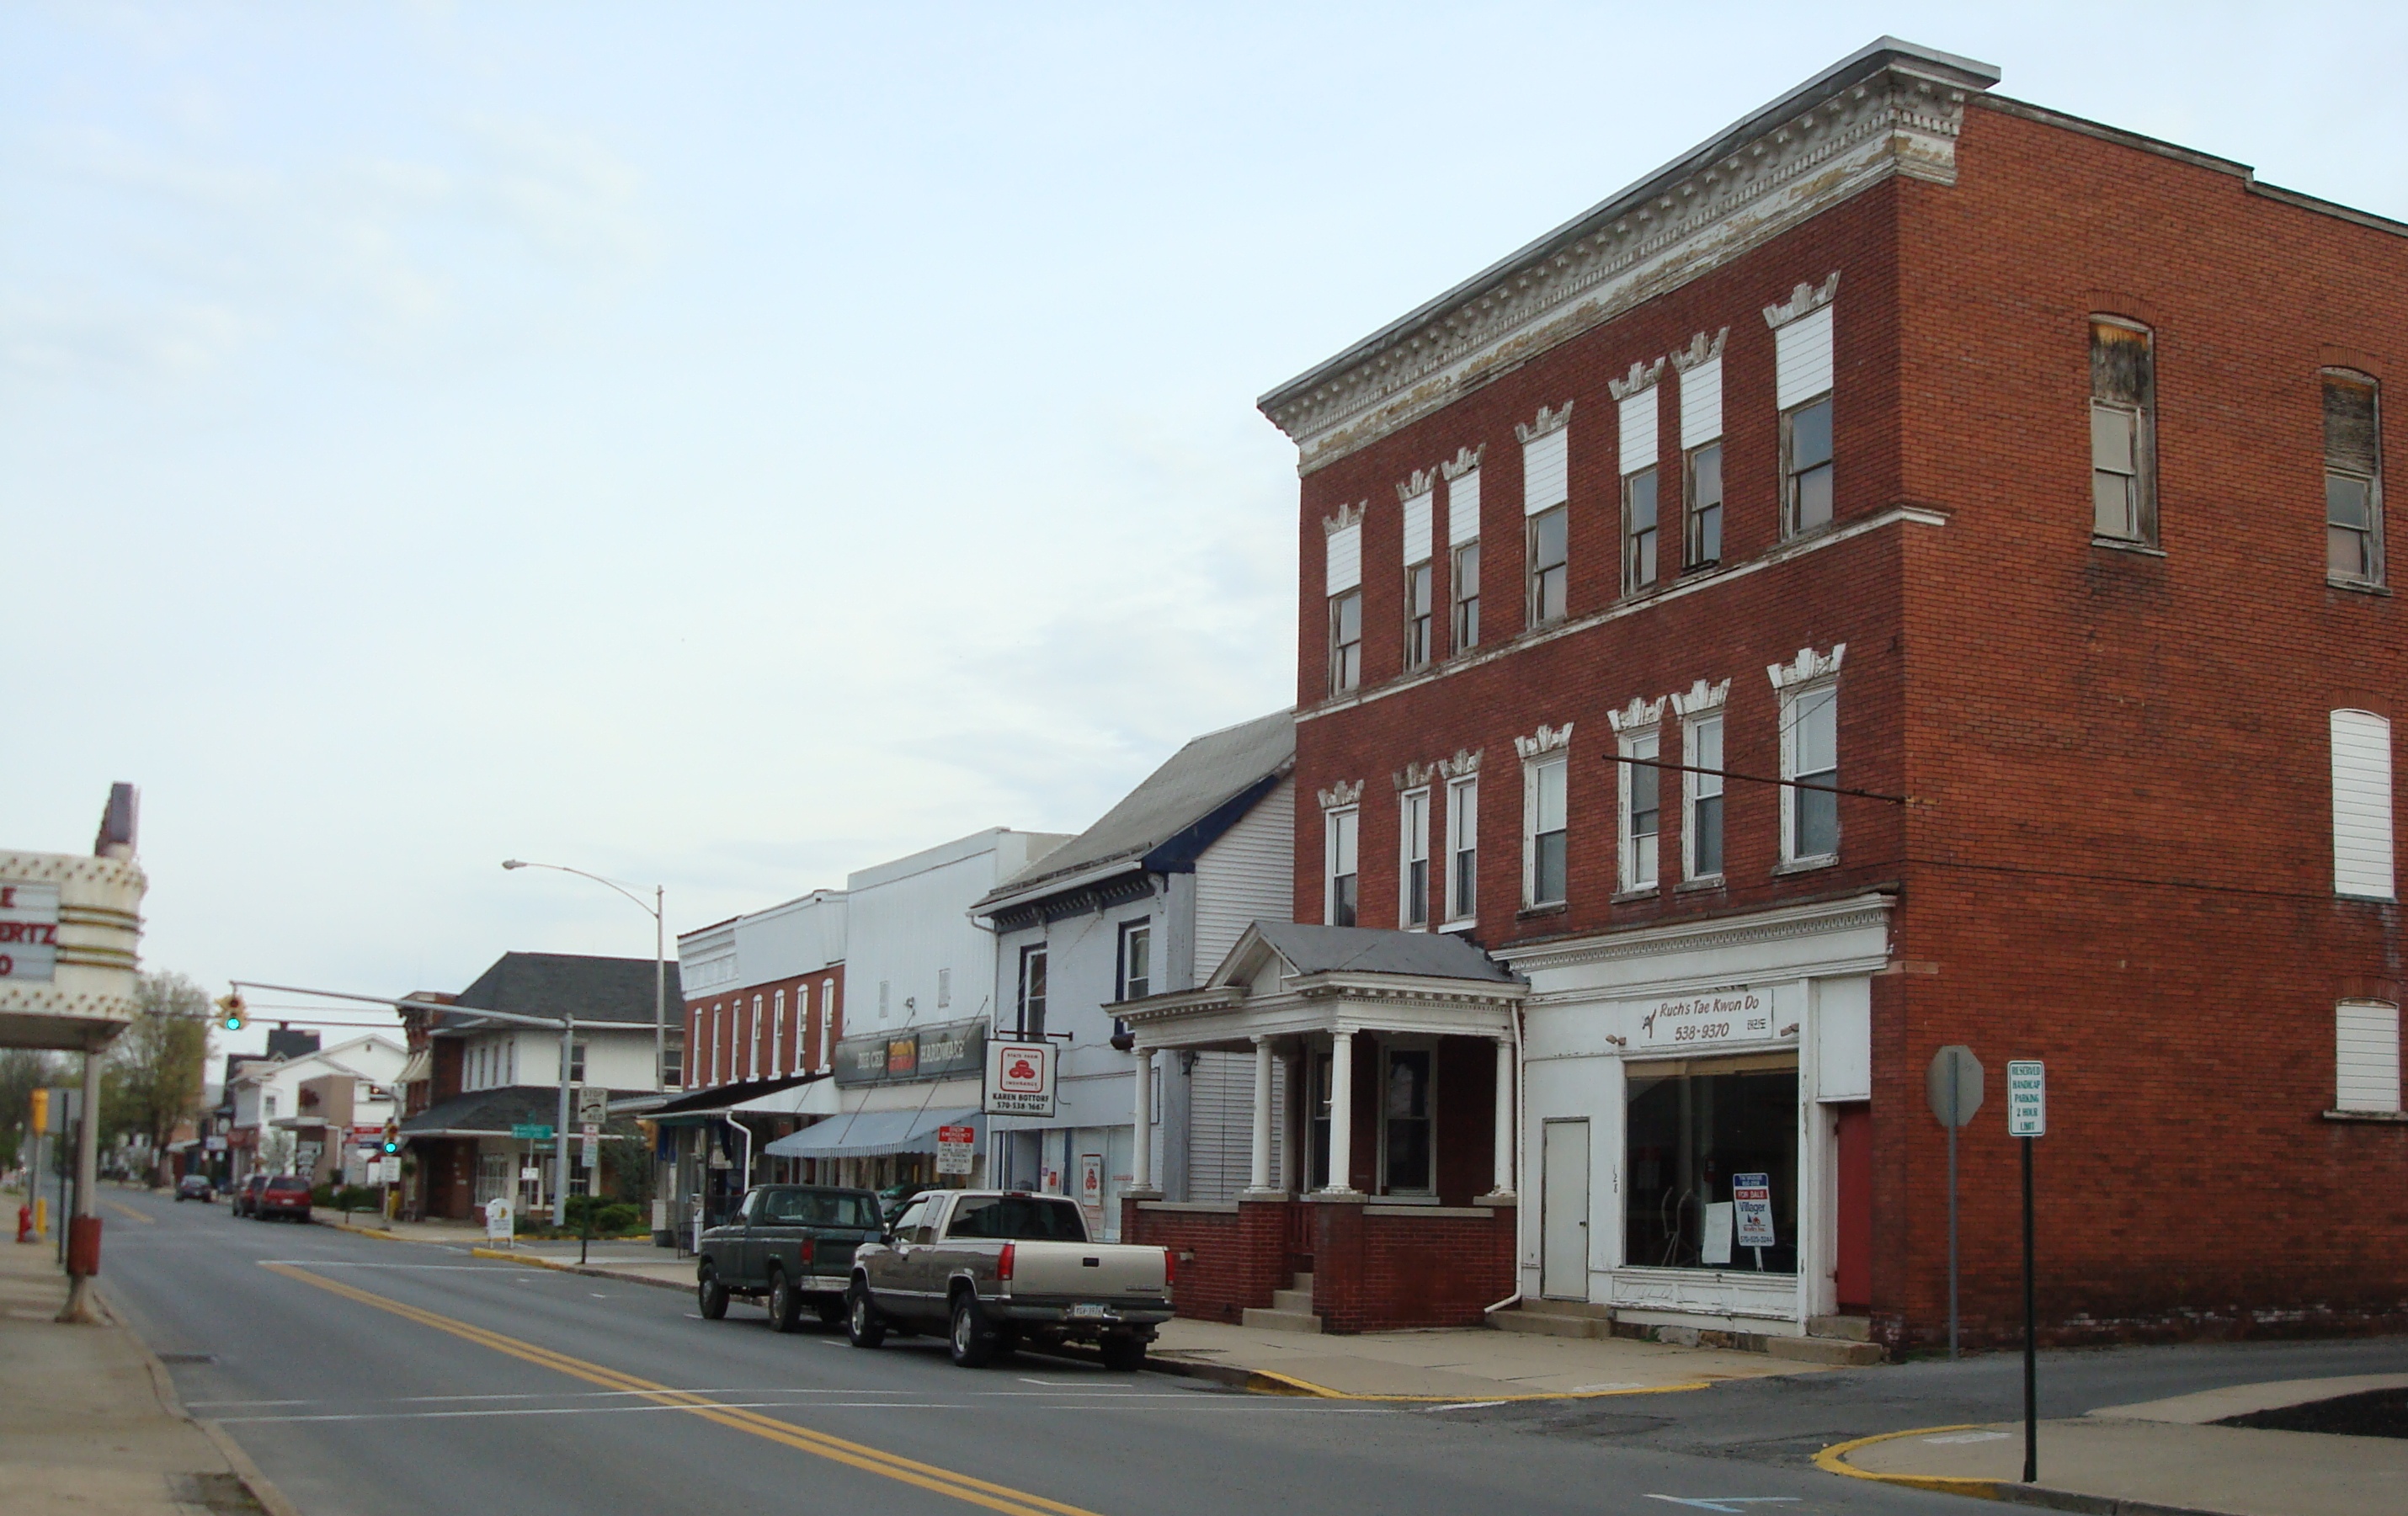
McEwensville was the small town, but the one Grandma went to the most frequently . It also was where she attended school. McEwensville was about 1 1/2 miles east of the Muffly farm. It had a general store, a pharmacy, a restaurant, and a few other businesses.
McEwensville
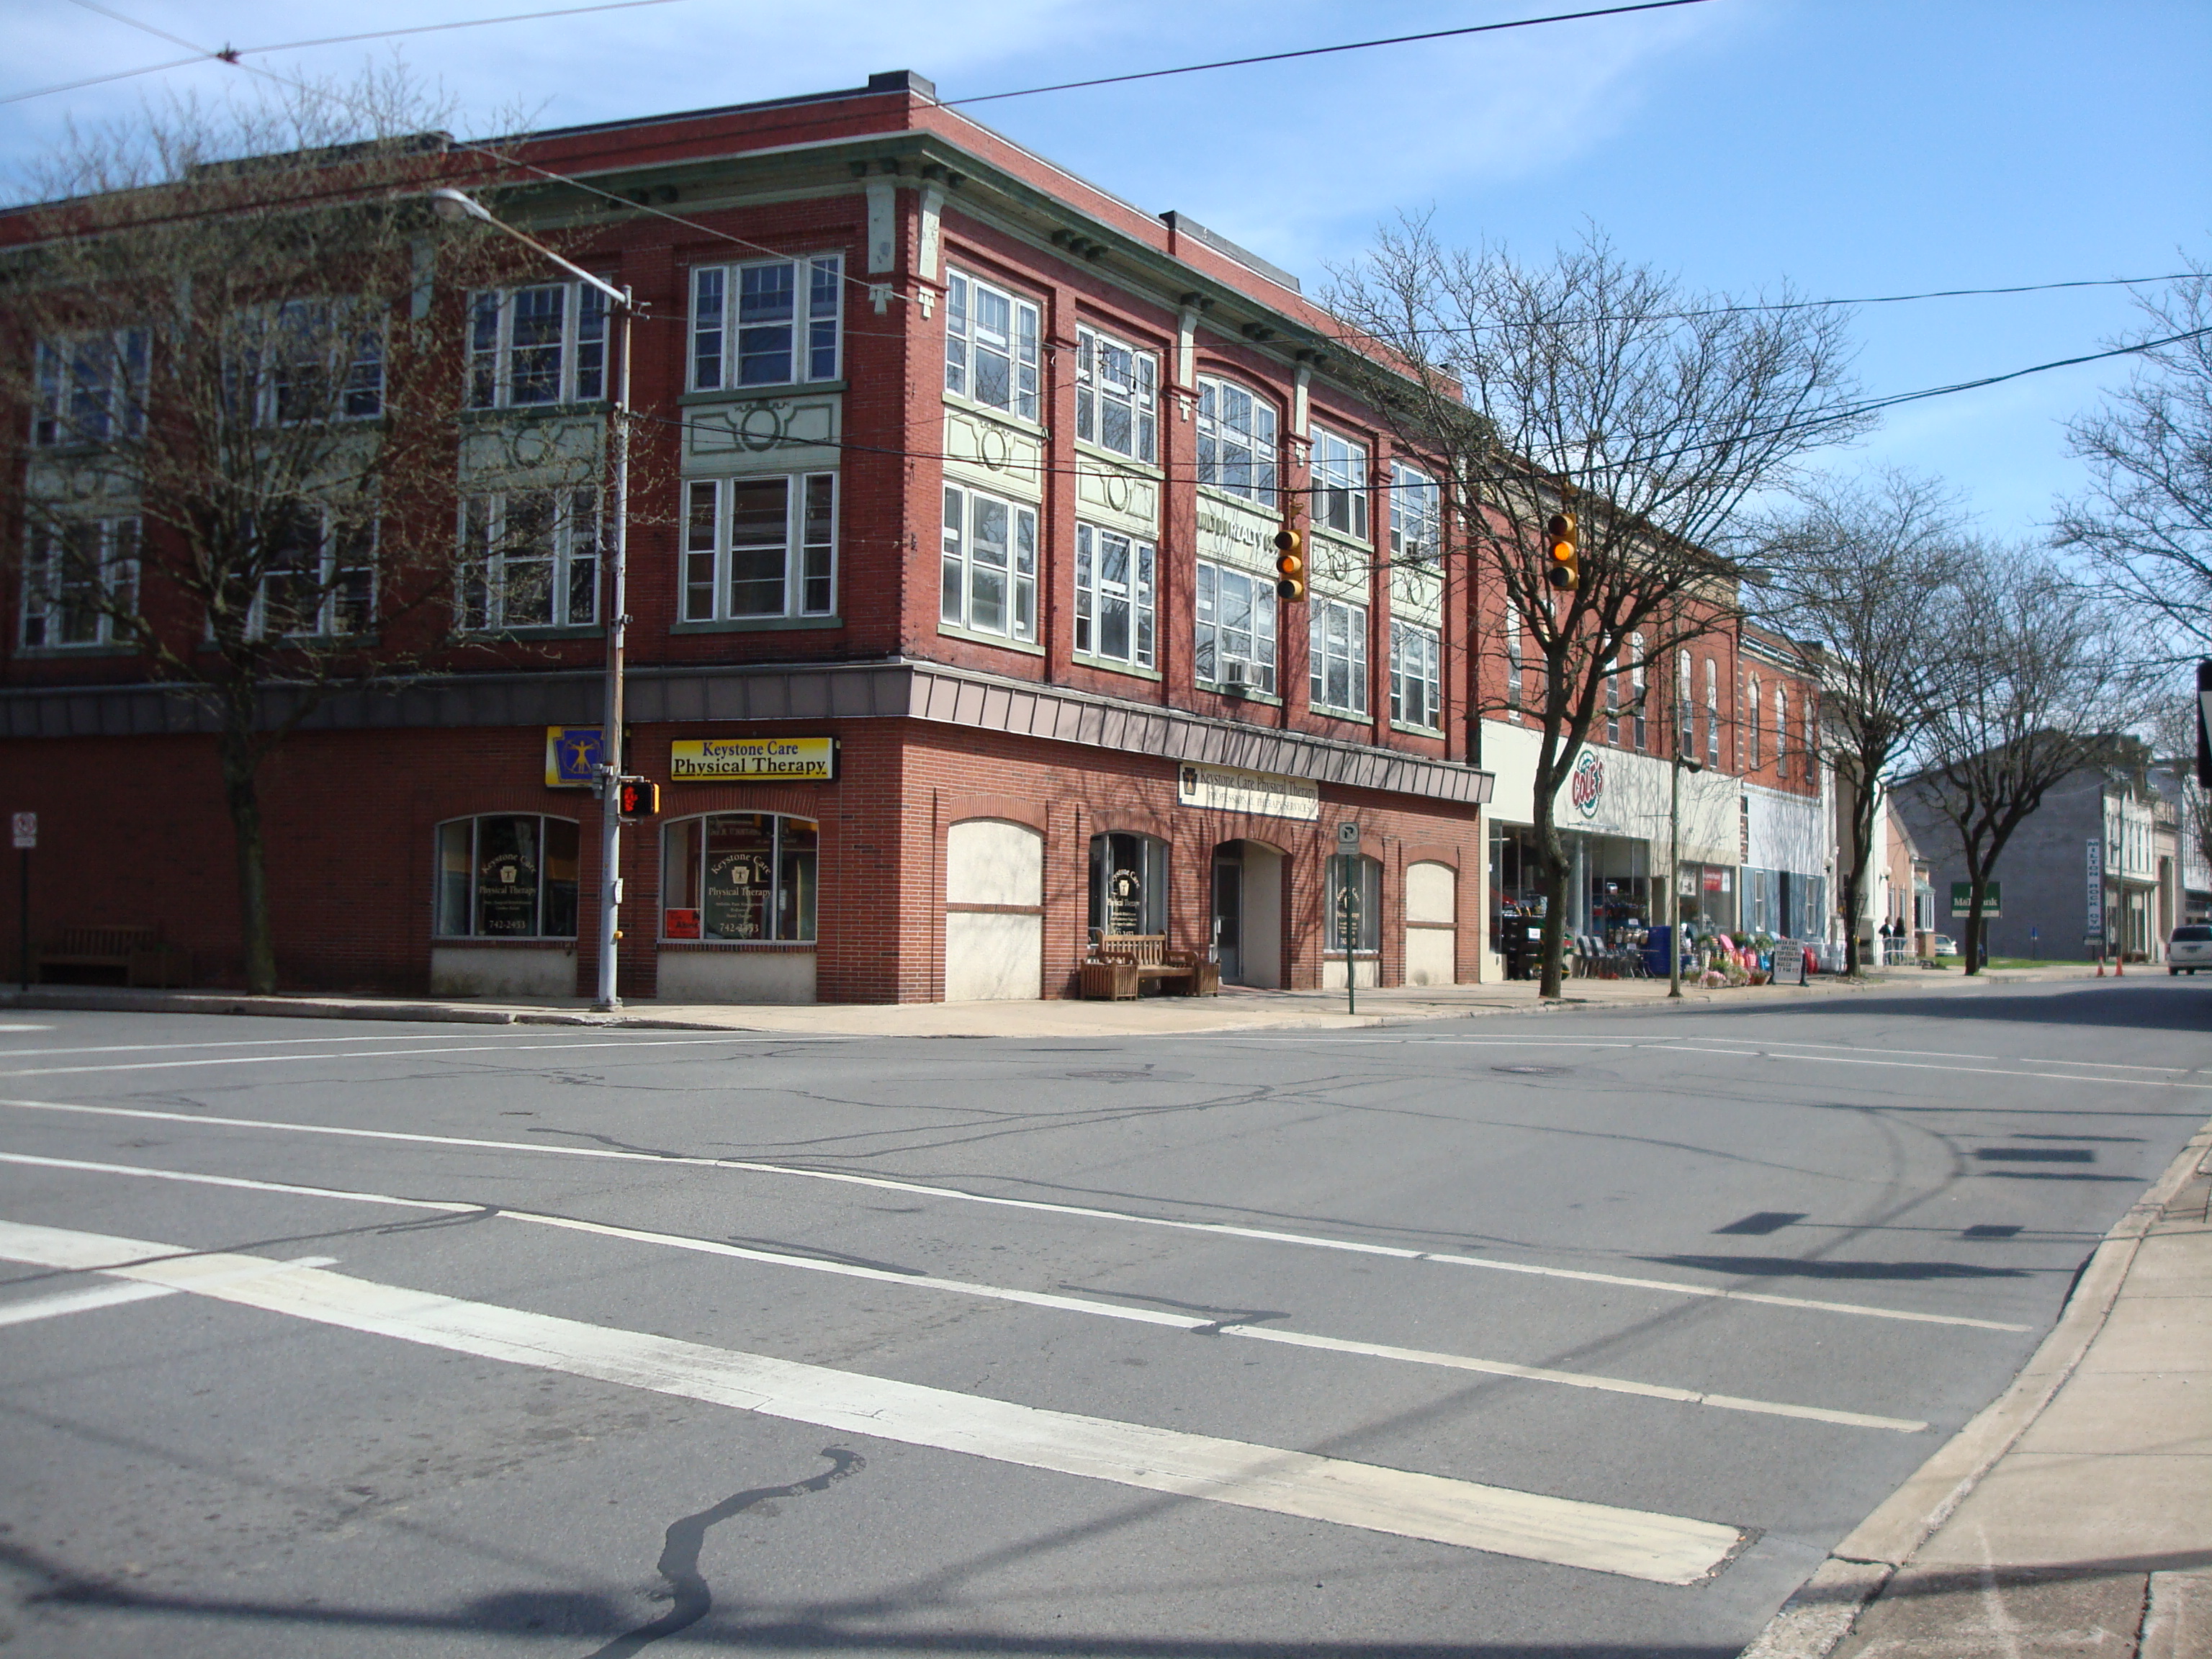
Watsontown was the medium sized town and where Grandma went a hundred years ago today. It was also about 1 1/2 miles from the Muffly farm, but in the opposite direction from McEwensville. Grandma often walked to Watsontown. It was to the west and is located along the West Branch of the Susquehanna River. It had a small downtown with a full range of stores where clothes, housewares, etc. could be purchased.
Watsontown
Milton was considered the “big city” in Grandma’s day—even though the population was only about 7,500 people. At the time, it was a considered a glamorous shopping destination with glittery department stores, women’s clothing shops, shoe stores, and restaurants. It was about 5 miles from the Muffly farm. Grandma would have either ridden in a buggy to get there—or she could have walked into Watsontown and then taken the trolley from Watsontown to Milton.
Milton
Since all three towns seem very sleepy today, I decided to see it they’d lost a lot of population across the years (see graph above). I was surprised to discover that the population had changed less than I expected between 1910 and 2010. Milton and Watsontown have lost a lot of factories since the 1970s—and many people moved away. It’s nice to see that the population trends have turned and that the population is increasing.
Links to Census Data Sets
I used data from US censuses to make the tables. There is an awesome amount of census data available for every town in the US. Here are the links to the Census population data for each of the years.
17-year-old Helena Muffly wrote exactly 100 years ago today:
Tuesday, November 5, 1912: I must excuse myself for this day.
Data Source: “Time Required to Complete Certain Tasks” in the October, 1912 issue of Ladies Home Journal. (Click on graph to enlarge.)
Her middle-aged granddaughter’s comments 100 years later:
Since Grandma didn’t write much a hundred years ago today, I’ll tell you how long it took to complete several household tasks in 1912.
Factory managers in the 1910s believed that workers should be timed doing various tasks to determine how long it took to complete each one.
There also was a movement toward the scientific management of households. Homemakers were encouraged to time how long it took to complete common tasks so that they could better plan their daily schedule.
17-year-old Helena Muffly wrote exactly 100 years ago today:
Tuesday, September 16, 1912: Just about the same things done over every day with just a little change here and a little more there.
Her middle-aged granddaughter’s comments 100 years later:
Both then and now– some days are just the same old, same old.
Since Grandma didn’t have much to say a hundred years ago today, I’m going to share some interesting data that I found about the average salaries for selected occupations a hundred years ago and now.
The 1912 data are from an article in the September, 1912 issue of Ladies Home Journal titled “How Other People Live.” The current data was from the Bureau of Labor Statistics.
Average Salaries, 1912 and 2012
Click on table to enlarge
Of course all the salaries are much higher now than they were back then because of inflation. But it’s interesting to compare which salaries were relatively high and which were relatively low across the two years.
Data Sources
This is what the 1912 Ladies Home Journal article said about the data sources for 1912: “The industrial incomes were obtained from the Government’s’ investigation of the incomes of over 3,000,000 adult males. The income for public school teachers is taken from a report of the United States Commissioner of Education for 1911. The salaries of city and country ministers are from the United States Census reports.”
I used the most recent data available from the Bureau of Labor Statistics for the 2012 data. It actually was 2011 data, but I assumed that salaries haven’t changed much over the past year.
17-year-old Helena Muffly wrote exactly 100 years ago today:
Tuesday, July 30, 1912:Nothing doing at all.
Her middle-aged granddaughter’s comments 100 years later:
Since Grandma didn’t write much a hundred years ago today, I’d like to share some interesting statistics about world crop production in 1912 and 2012.
According to the July 30, 1912 issue of the New York Times:
We Lead in Crops
The Bureau of Statistics of the Department of Agriculture concluded today a resume of the production of staple crops throughout the world which presents the latest information in such line of inquiry.
It shows that the United States stands first in the production of corn, wheat, oats, cotton, tobacco, and hops. The relative rank of the United States in the world’s exports is first in wheat, flour, cotton, cottonseed oil, tobacco, oilcake and oilcake meal, rosin, and turpentine.
The United States produces 19.8 per cent of the world’s wheat crop, 74.8 per cent of the world’s corn crop, 24 per cent of the oat crop of the world, 59 per cent of its cotton, 31 per cent of its tobacco, and 25 per cent of its flaxseed.
Click on figure to enlarge.
The US produces a lower percentage of the world’s total production of wheat, corn, oats, cotton, and tobacco now than in 1912—though of course the actual amount produced would be higher. (A previous post provides data about actual crop yields a hundred years ago and now.)
Click on table to enlarge.
In both 1912 and 2012, the US was the largest producer in the world of corn.
If you care about the details about how I compiled the data in the figures–
If 2012 data wasn’t available for a crop, I used data from the most recent year available and assumed that it was the same in 2012.
If you’d like to dig deeper into crop current crop production data here are some useful resources: